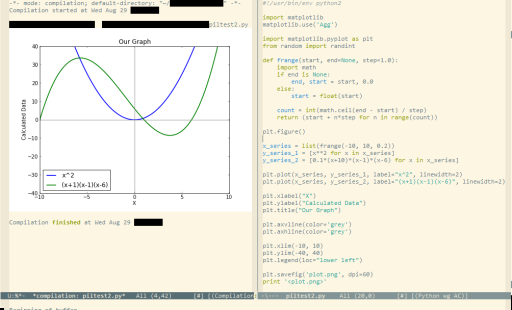
Images in emacs buffer
Building upon having script output in emacs buffers, I want to display images as part of the scripts output. Having recently seen inline images in org-mode.
So we first enable the mode (add to .emacs):
(iimage-mode)
or M-x iimage-mode. Now text that matches a regex in iimage-mode-image-regex-alist will be replaced with the actual image. By default this matches bare image filenames, and filenames within angle brackets (<>).
Then we need to update images (which is not done on the fly) in a hook after compilation. The compilation-finish-functions appears to be the hook to use.
(defun refresh-iimages ()
  "Only way I've found to refresh iimages (without also recentering)"
  (interactive)
  (clear-image-cache nil)
  (iimage-mode nil)
  (iimage-mode t))

(add-to-list 'compilation-finish-functions
             (lambda (buffer msg)
               (save-excursion
                 (set-buffer buffer)
                 (refresh-iimages))))
The call to clear-image-cache is to prevent the images being cached. I’ve been unable to find a way of just flushing the images used within a specific buffer. Calling iimage-mode with nil then t, disables then enables the minor-mode, causing it to refind all images within the buffer.
So let’s try it with some python, creating a simple image with PIL:
#!/usr/bin/env python2

import Image
import ImageDraw

im = Image.new('RGB', (100, 30), (10, 30, 0))
draw = ImageDraw.Draw(im)

draw.text((10, 10), 'Hello, World!', fill=(0, 120, 255))

im.save('foo.png', 'PNG')

print '<foo.png>'
And of course, plotting using mathplotlib. Ideally some of this would be in a helper library.
#!/usr/bin/env python2

import matplotlib
matplotlib.use('Agg')

import matplotlib.pyplot as plt
from random import randint

def frange(start, end=None, step=1.0):
    import math
    if end is None:
        end, start = start, 0.0
    else:
        start = float(start)

    count = int(math.ceil(end - start) / step)
    return (start + n*step for n in range(count))

plt.figure()

x_series = list(frange(-10, 10, 0.2))
y_series_1 = [x**2 for x in x_series]
y_series_2 = [0.1*(x+10)*(x-1)*(x-6) for x in x_series]

plt.plot(x_series, y_series_1, label="x^2", linewidth=2)
plt.plot(x_series, y_series_2, label="(x+1)(x-1)(x-6)", linewidth=2)

plt.xlabel("X")
plt.ylabel("Calculated Data")
plt.title("Our Graph")

plt.axvline(color='grey')
plt.axhline(color='grey')

plt.xlim(-10, 10)
plt.ylim(-40, 40)
plt.legend(loc="lower left")

plt.savefig('plot.png', dpi=60)
print '<plot.png>'
You have to print out the filename as part of the output, so iimage-mode will replace the filename with the actual image. Here’s what it actually looks like:
